about
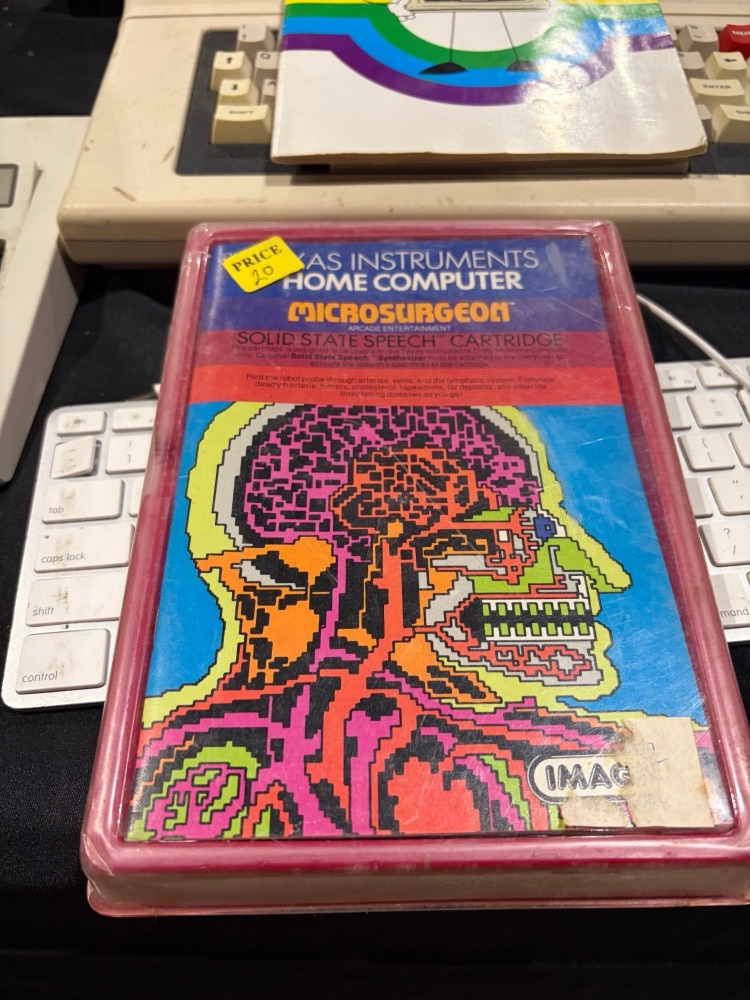
This tracer was inspired by the TI-99 cover art for
Microsurgeon
I saw at the 2026 Vintage Computer Festival Midwest. Not intended to be indentical, maybe another day.
Play the Intellivision emulation on the
Internet Archive
how it works
Vanilla js/css/html creates an SVG on the colors of your image. It isn't saved or anything, I do
not want it.
Designed for use with an axidraw pen plotter and bantam's inkscape extension but use however you like.
1. color clusters
The image's pixels are sorted into groups of similar colors with
k-means clustering. The clusters change based
on the number of colors you set.
2. pixelation
The image is broken down into a grid of square cells based on "pixel size". Each cell takes on the majority color of its cells, based on the clustering in step one.
3. hatching
Each region of pixels with the same color is filled with parallel lines at hatch angle 1, then again at hatch
angle 2. Change the density of the lines with line spacing. continuous hatch connects
neighboring lines of the same color. Fewer distinct lines means faster plots.
4. outline
The outline follows edges where two colors meet. Visibility changes with color regions.
5. line colors
The default palette is loosely derived from the Microsurgeon cover art, always applied in the same order
based on cluster size. shuffle colors reassigns color regions at random. Region colors can also be set
manually.